Smart Building-related Mobility: Difference between revisions
No edit summary |
No edit summary |
||
| (19 intermediate revisions by 2 users not shown) | |||
| Line 4: | Line 4: | ||
|authors=Yuri Gawdiak, Wilfred Pinfold, Jiri Skopek | |authors=Yuri Gawdiak, Wilfred Pinfold, Jiri Skopek | ||
|blueprint=Smart Buildings | |blueprint=Smart Buildings | ||
|sectors=Buildings, Transportation | |sectors=Buildings, Transportation, Smart Buildings | ||
|summary=Buildings have a very symbiotic relationship with transportation. People have to get to the buildings on foot, by bicycle or other mobility devices, public transport or car (in exceptional cases by helicopter and in future by drone). Cars have created a demand for parking space in the building. Then there are deliveries and waste collection typically by trucks. | |summary=Buildings have a very symbiotic relationship with transportation. People have to get to the buildings on foot, by bicycle or other mobility devices, public transport or car (in exceptional cases by helicopter and in future by drone). Cars have created a demand for parking space in the building. Then there are deliveries and waste collection typically by trucks. | ||
}} | }} | ||
| Line 17: | Line 17: | ||
<span id="Figure 1">[[File:Fig1Chap7.jpg|600px|center|Figure 1. NASA’s Urban Air Mobility Concept]]<center>Figure 1. NASA’s Urban Air Mobility Concept</center></span> | <span id="Figure 1">[[File:Fig1Chap7.jpg|600px|center|Figure 1. NASA’s Urban Air Mobility Concept]]<center>'''Figure 1. NASA’s Urban Air Mobility Concept'''</center></span> | ||
Smart Buildings will both leverage this new evolution in mobility as well as enable and enhance it by acting as key departure and destination nodes with advanced capabilities and structures. | Smart Buildings will both leverage this new evolution in mobility as well as enable and enhance it by acting as key departure and destination nodes with advanced capabilities and structures. | ||
| Line 35: | Line 35: | ||
Here are some possible KPIs that could be used: | Here are some possible KPIs that could be used: | ||
'''Accessibility''': | <span id="Accessibility">'''Accessibility''':</span> | ||
* Number of transportation modes available within a certain distance. | * Number of transportation modes available within a certain distance. | ||
* Distance to the nearest public transit stop. | * Distance to the nearest public transit stop. | ||
| Line 51: | Line 51: | ||
* Existence of Control Systems for Natural Disaster Emergency [https://opencommons.org/Community_Traffic_Guidance_and_Control_System_for_Natural_Disaster_Emergency_Response] | * Existence of Control Systems for Natural Disaster Emergency [https://opencommons.org/Community_Traffic_Guidance_and_Control_System_for_Natural_Disaster_Emergency_Response] | ||
'''Environmental Impact:''' | <span id="Environmental Quality">'''Environmental Impact:'''</span> | ||
* Average CO2 emissions per capita associated with commuting. | * Average CO2 emissions per capita associated with commuting. | ||
* Percentage of trips made by low-emission vehicles (e.g., electric cars, hybrids). | * Percentage of trips made by low-emission vehicles (e.g., electric cars, hybrids). | ||
| Line 72: | Line 72: | ||
These KPIs could be adapted depending on the specific goals of the organization or project. For instance, a city trying to improve accessibility might focus on the proximity and frequency of transit services, while a company looking to promote sustainable commuting might place more emphasis on the modal split and CO2 emissions per capita. | These KPIs could be adapted depending on the specific goals of the organization or project. For instance, a city trying to improve accessibility might focus on the proximity and frequency of transit services, while a company looking to promote sustainable commuting might place more emphasis on the modal split and CO2 emissions per capita. | ||
<span id="Figure 3"> | |||
<imagemap> | |||
File:Building-related Mobility.jpg|520px|center|<div style='text-align: center;'>'''Figure 3: Relationship of the three H-KPI levels of the Building-related Transportation/ Mobility </br> ( In the web version clicking on the particular component of the diagram will take you to the relevant text section)'''</div> | |||
== | rect 54 18 159 62 [[#Accessibility|Accessibility]] | ||
rect 172 18 278 62 [[Wellbeing|Health and Wellbeing]] | |||
rect 290 18 440 62 [[#Environmental Quality|Environmental Quality]] | |||
rect 32 107 396 130 [[Grid-Interactive, Efficient and Connected Buildings (GEBs)|Benefits of Grid-Connected Responsive Buildings]] | |||
rect 67 175 177 220 [[Transportation|Transportation]] | |||
rect 218 175 317 220 [[Shared Mobility|Mobility Devices]] | |||
rect 34 261 397 286 [[Smart Buildings O&M|Smart Building IoT Infrastructure]] | |||
</imagemap> | |||
<center>'''Figure 3: Relationship of the three H-KPI levels of the Building-related Transportation/ Mobility'''</br> ( In the web version clicking on the particular component of the diagram will take you to the relevant text section)</div></center> | |||
==New Mobility Modes and Operations Infrastructure== | |||
New mobility modes are being driven by two relatively new vectors: increased battery power and density and autonomous systems. | New mobility modes are being driven by two relatively new vectors: increased battery power and density and autonomous systems. | ||
'''<big>Electric Systems</big>''' | '''<big>Electric Systems</big>''' | ||
<hr> | <hr> | ||
<span style="color:#000000;">Increased battery power is leading to a whole new range mobility systems that are radically resizing mobility capabilities to better fit actual passenger and cargo demand. These systems can include a range of vehicles from bikes, to scooters, to mopeds, and other unique and custom designed delivery systems [Figure | <span style="color:#000000;">Increased battery power is leading to a whole new range mobility systems that are radically resizing mobility capabilities to better fit actual passenger and cargo demand. These systems can include a range of vehicles from bikes, to scooters, to mopeds, and other unique and custom designed delivery systems [[Figure 4|Figure 4]]. This new capability is being enhanced by networked intelligent services enabling on demand capabilities: providing the right vehicle, at the right time, at the right place. This capability begins to obviate the high cost of flexibility evident in today’s automotive concepts where passenger cars</span><span style="color:#000000;"><ref name="ftn1">[https://www.eia.gov/todayinenergy/detail.php?id=36674 Crossover utility vehicles have become the most popular light-duty vehicle type. Their increased robustness and flexibility comes at the cost of decreased fuel efficiency over regular passenger vehicles.]<span style="color:#000000;"> </span></ref></span><span style="color:#000000;"> are designed for an average of 4-5 passengers, but are mostly occupied by 1.67 individuals</span><span style="color:#000000;"><ref name="ftn2">[https://nhts.ornl.gov/assets/2017_nhts_summary_travel_trends.pdf 2017 National Household Travel Survey by the Federal Highway Administration (FHWA)]</ref></span><span style="color:#000000;">.</span> | ||
<span id="Figure | <span id="Figure 4">[[File:Fig2Chap7.png|600px|center|Figure 4. Transition to On Demand, Green, Load Optimized, Intelligent, Mobile Systems ''Source: By Author'']] | ||
< | <center> '''Figure 4. Transition to On Demand, Green, Load Optimized, Intelligent, Mobile Systems [Source: By Author]'''</center></span> | ||
<span style="color:#000000;">The on demand services are further enhanced by support from smart buildings with local green power generation as well adaptable and reconfigurable spaces that can support and compliment these new mobility services at key demand locations by not only providing recharging/refueling capabilities, but also safe and efficient storage and docking of the systems when not in use. </span> | <span style="color:#000000;">The on demand services are further enhanced by support from smart buildings with local green power generation as well adaptable and reconfigurable spaces that can support and compliment these new mobility services at key demand locations by not only providing recharging/refueling capabilities, but also safe and efficient storage and docking of the systems when not in use. </span> | ||
| Line 94: | Line 106: | ||
'''<big>Autonomous Systems</big>''' | '''<big>Autonomous Systems</big>''' | ||
<hr> | <hr> | ||
<span style="color:#000000;">The more fundamental change to mobility is the planning and development of increasingly autonomous, unmanned systems. [Figure | <span style="color:#000000;">The more fundamental change to mobility is the planning and development of increasingly autonomous, unmanned systems. [[#Figure 5|Figure 5]]. These systems are being built for an increasing number of environments, not only externally (air, marine, and surface), but also with within structures (confined spaces around buildings as well as within them such as corridors, pipes, ducts, and conduits of various kinds).</span> | ||
<span id="Figure | <span id="Figure 5">[[File:Fig3Chap7.png|800px|center|Figure 5. Increasing Autonomous Systems - External ''Source: By Author'']] | ||
< | <center>'''Figure 5. Increasing Autonomous Systems - External [Source: By Author]'''</center></span> | ||
New forms of increasingly autonomous mobility systems are at various stages of maturity and deployment providing enhanced or new capabilities in: | New forms of increasingly autonomous mobility systems are at various stages of maturity and deployment providing enhanced or new capabilities in: | ||
| Line 139: | Line 151: | ||
<div style="text-align:center;"></div> | <div style="text-align:center;"></div> | ||
<span id="Figure 6">[[File:Fig4Chap7.png| | <span id="Figure 6">[[File:Fig4Chap7.png|800px|center|Figure 6.Increasingly Autonomous Systems - Internal]] | ||
<div style="text-align:center;">'''Figure | <div style="text-align:center;">'''Figure 6.Increasingly Autonomous Systems - Internal <span style="color:#000000;">[Source: By Author]'''</span><ref name="ftn5">[https://pages.nist.gov/GCTC/ Concept developed at the 2018 Global Cities Team Challenges Conference, Washington, D.C.]</ref></div></span> | ||
This is an unprecedent explosion of new modes of mobility [Figure | This is an unprecedent explosion of new modes of mobility [[#Figure 6|Figure 6]]. The challenge to states, regions, communities and cities are immense. There is a very high risk of suboptimal designs and implementations if these changes are addressed independently and asynchronously. The Copenhagenize Index<ref name="ftn6">[https://copenhagenize.eu Copenhagenize Design Co.]<span style="color:#000000;"> </span></ref> has been developed to help rank the holistic aspects of cities to support bicycle-friendly transportation services. We’re recommending for the Smart Building and Transportation Superclusters to build off the Copenhagenize Index and to expand it to cover these new modes and multimodal operations to better help track and manage efforts in this critical area. | ||
'''<big>Smart City Mesh Network</big>''' | '''<big>Smart City Mesh Network</big>''' | ||
<hr> | <hr> | ||
<span style="color:#000000;">The proliferation of new modes of mobility including intelligent systems operating on, in, and around buildings will require building level traffic management capabilities merged with security and operations systems to ensure overall location safety and efficiency. [Figure | <span style="color:#000000;">The proliferation of new modes of mobility including intelligent systems operating on, in, and around buildings will require building level traffic management capabilities merged with security and operations systems to ensure overall location safety and efficiency. [[#Figure 6|Figure 6]]. Integration of new mobility operations are a key evolving aspect of the Smart City Mesh Network, providing adaptive multimodal capabilities to best meet dynamic physical interaction demands [[#Figure 7|Figure 7]]. </span> | ||
<span id="Figure 7"> | <span id="Figure 7">[[File:Fig5Chap7.jpg|1000px|center]] | ||
< | <center> '''Figure 7. Smart City Mesh Network [Source: By Author]'''</center></span> | ||
This mobility adaptability is organized around: | This mobility adaptability is organized around: | ||
| Line 157: | Line 169: | ||
# <span style="color:#000000;">City level for city-wide accommodations to increase overall systems-of-systems efficiencies or adaptations to deal with emergencies and/or large-scale, unique events. </span> | # <span style="color:#000000;">City level for city-wide accommodations to increase overall systems-of-systems efficiencies or adaptations to deal with emergencies and/or large-scale, unique events. </span> | ||
== | ==Mobility Traffic Management Systems & Services== | ||
'''<big>Historic Traffic Management Drivers</big>''' | '''<big>Historic Traffic Management Drivers</big>''' | ||
| Line 163: | Line 175: | ||
<span style="color:#000000;">In terms of traditional transportation, a key feature, for safety and efficiency reasons, has been the implementation of traffic management control signage and active flow control systems. Traffic management is usually located in either areas of high density or where active right of ways need to be provided. Examples of these are surface streets with traffic lights, stops signs, or buoys in harbors, or airport & ramp towers using surface markers and digital systems to control local aircraft operations and flows. Typically, where there’s low density or very complex individual operations we rely on humans to provide safe separation and integration. Examples are farms, warehouses, construction sites, open oceans, and visual flight rules with general aviation.</span> | <span style="color:#000000;">In terms of traditional transportation, a key feature, for safety and efficiency reasons, has been the implementation of traffic management control signage and active flow control systems. Traffic management is usually located in either areas of high density or where active right of ways need to be provided. Examples of these are surface streets with traffic lights, stops signs, or buoys in harbors, or airport & ramp towers using surface markers and digital systems to control local aircraft operations and flows. Typically, where there’s low density or very complex individual operations we rely on humans to provide safe separation and integration. Examples are farms, warehouses, construction sites, open oceans, and visual flight rules with general aviation.</span> | ||
<span id="Figure 8"> | <span id="Figure 8">[[File:Fig6Chap7.png|1000px|center]] | ||
< | <center> '''Figure 8. Interactions of Autonomous Traffic Management Systems & Services [Source: By Author]'''</center></span> | ||
'''<big>New Mobility Management Systems</big>''' | '''<big>New Mobility Management Systems</big>''' | ||
Latest revision as of 17:09, July 31, 2023
| Smart Buildings | |
|---|---|

| |
| Sectors | Buildings Transportation Smart Buildings |
| Contact | Yuri Gawdiak |
| Topics | |
- Authors


Buildings have a very symbiotic relationship with transportation. People have to get to the buildings on foot, by bicycle or other mobility devices, public transport or car (in exceptional cases by helicopter and in future by drone). Cars have created a demand for parking space in the building. Then there are deliveries and waste collection typically by trucks.
We are now in another major phase driven by the necessity to unclog cities’ traffic congestion, decarbonize and clean the air pollution supported by an acceleration of new transportation capabilities enabled by increasingly dense, and powerful, electric based propulsion systems as well as advances in: communication, navigation, and command & control. In addition, increasingly intelligent systems are being developed and integrated creating an emerging capability of autonomous operations. National Aeronautics and Space Administration’s (NASA) Urban Air Mobility concept is an example that has been enabled by these new technology capabilities. Figure 1.0.
The respective parts of the document consist of the following:
- Benefits Building related Transportation/ Mobility
- The Building-related Transportation/ Mobility KPI’s section identifies the criteria by which the effectiveness of the Transportation/ Mobility solutions can be measured.
- Mobility Modes and Operations Infrastructure describes the various new mobility features and technologies.
- Finally Case studies section provides examples of the Transportation/ Mobility solutions.

Smart Buildings will both leverage this new evolution in mobility as well as enable and enhance it by acting as key departure and destination nodes with advanced capabilities and structures.
Developing smart buildings with mobility as one of the integrated design considerations brings forth a broad range of civic outcome benefits.

In the context of building-related transportation or mobility, KPIs are used to gauge the efficiency, effectiveness, and sustainability of transport systems and infrastructure associated with buildings and urban development. These could include measures related to access, connectivity, efficiency, safety, and environmental impact.
Here are some possible KPIs that could be used:
Accessibility:
- Number of transportation modes available within a certain distance.
- Distance to the nearest public transit stop.
- Percentage of residents/employees within a walkable distance to public transit.
Connectivity:
- Frequency of public transit services.
- Number of direct connections to key destinations (e.g., downtown, major employment centers, etc.).
Efficiency:
- Average commute time for building occupants.
- Percentage of trips made by walking, biking, or public transit (modal split).
- Level of service for nearby public transit.
Safety:
- Number of accidents involving pedestrians or cyclists near the building. [1]
- Existence and quality of pedestrian and cyclist infrastructure (e.g., sidewalks, bike lanes, etc.).
- Existence of Control Systems for Natural Disaster Emergency [2]
Environmental Impact:
- Average CO2 emissions per capita associated with commuting.
- Percentage of trips made by low-emission vehicles (e.g., electric cars, hybrids).
- Air Quality improvements [3]
Parking Efficiency:
- Ratio of parking spaces to building occupants.
- Usage rate of parking spaces.
- Availability of bike parking spaces.
Sustainability:
- Implementation of sustainable transport solutions (carpooling, car sharing, bike sharing programs).
- Existence of electric vehicle charging stations.
- Implementation of a travel plan promoting sustainable mobility among building occupants.
Infrastructure Quality:
- Rating of local road, transit, and active transportation infrastructure. [4]
- Availability and quality of accessible facilities for people with disabilities.
These KPIs could be adapted depending on the specific goals of the organization or project. For instance, a city trying to improve accessibility might focus on the proximity and frequency of transit services, while a company looking to promote sustainable commuting might place more emphasis on the modal split and CO2 emissions per capita.
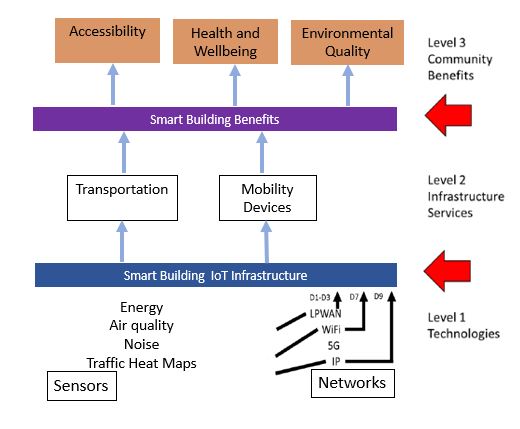

( In the web version clicking on the particular component of the diagram will take you to the relevant text section)
New Mobility Modes and Operations Infrastructure
New mobility modes are being driven by two relatively new vectors: increased battery power and density and autonomous systems.
Electric Systems
Increased battery power is leading to a whole new range mobility systems that are radically resizing mobility capabilities to better fit actual passenger and cargo demand. These systems can include a range of vehicles from bikes, to scooters, to mopeds, and other unique and custom designed delivery systems Figure 4. This new capability is being enhanced by networked intelligent services enabling on demand capabilities: providing the right vehicle, at the right time, at the right place. This capability begins to obviate the high cost of flexibility evident in today’s automotive concepts where passenger cars[1] are designed for an average of 4-5 passengers, but are mostly occupied by 1.67 individuals[2].

The on demand services are further enhanced by support from smart buildings with local green power generation as well adaptable and reconfigurable spaces that can support and compliment these new mobility services at key demand locations by not only providing recharging/refueling capabilities, but also safe and efficient storage and docking of the systems when not in use.
Augmenting Smart Buildings with shared, local neighborhood mobility systems can also allow deliveries to be done more efficiently. Instead of large delivery vehicles having to visit each building and block traffic, large delivery vehicles can pause at the periphery of walkable neighborhoods and zones and have shared intelligent autonomous neighborhood UAS’s and UGV’s meet them there and make the final deliveries, freeing up the large delivery vehicles from having to wait for the UAS’s & UGV’s to return. That improves the delivery speeds, reduces congestion, noise, and emissions.
These trends are emerging from various socioeconomic drivers. The COVID-19 Pandemic response in Seattle in May 2020 is an example of one such community adaptation: “Seattle to permanently close 20 miles of streets to traffic so residents can exercise and bike on them.”[3] This society’s desire to make walkable communities naturally comes with collateral benefits such as: reductions in noise, energy usage, and decreased vehicle size and weights improving safety. Another example is a 2020 campaign platform for the mayor of Paris, “Every Street in Paris to be Cycle-Friendly by 2024, Promises Mayor – Should she get reelected as Mayor of Paris, Anne Hidalgo plans to turn the French capital into a myriad of neighborhoods where ‘you can find everything you need within 15 minutes from home’.[4]”
These socioeconomic trends point to the need for smart buildings and cities to revise their architectural concepts to include more sophisticated and modern interfaces, docking, staging, and access methods for small drones, unmanned ground/air vehicles, and personal vehicle rentals, to provide local, on demand shared & public passenger/cargo capabilities. The successful implementation of more integral structural & services accommodations for smart buildings will help prevent scooters, bikes, and other systems from being carelessly left out in the streets, clogging operations, and getting prematurely damaged, but rather enable more safe & efficient building/neighborhood quality of life improvements by providing equitable and reconfigurable access and enhanced synergies for the new mobility operations & business models.
Autonomous Systems
The more fundamental change to mobility is the planning and development of increasingly autonomous, unmanned systems. Figure 5. These systems are being built for an increasing number of environments, not only externally (air, marine, and surface), but also with within structures (confined spaces around buildings as well as within them such as corridors, pipes, ducts, and conduits of various kinds).

New forms of increasingly autonomous mobility systems are at various stages of maturity and deployment providing enhanced or new capabilities in:
- Automated Cargo Delivery
- Traditional: ground, air, and sea
- Last mile package delivery
- Airborne delivery to and from mobile systems
- Internal Structures: Office/Desk/Work Station package delivery
- Mobile Robotic Security & Surveillance Systems
- Mobile Robotic Inspections
- External – buildings, sites and geographic locations
- Internal (small & micro UAS)
- Pipes
- Vents
- Conduits
- Etc..
- Mobile Robotic Cleaning Systems
- Mobile Robotic Lawn Care & Landscaping
- Automated Fire Fighting & Rescue Systems
- Autonomous Site Coordination & Mobile Operations Safety Monitoring Systems
- Personal Flight Following Systems
- On Demand Mobility Services
- On Demand Autonomous Vehicle Rentals
- Autonomous Urban Air Mobility
- Others

This is an unprecedent explosion of new modes of mobility Figure 6. The challenge to states, regions, communities and cities are immense. There is a very high risk of suboptimal designs and implementations if these changes are addressed independently and asynchronously. The Copenhagenize Index[6] has been developed to help rank the holistic aspects of cities to support bicycle-friendly transportation services. We’re recommending for the Smart Building and Transportation Superclusters to build off the Copenhagenize Index and to expand it to cover these new modes and multimodal operations to better help track and manage efforts in this critical area.
Smart City Mesh Network
The proliferation of new modes of mobility including intelligent systems operating on, in, and around buildings will require building level traffic management capabilities merged with security and operations systems to ensure overall location safety and efficiency. Figure 6. Integration of new mobility operations are a key evolving aspect of the Smart City Mesh Network, providing adaptive multimodal capabilities to best meet dynamic physical interaction demands Figure 7.

This mobility adaptability is organized around:
- Individual smart building level with reconfigurable entrances, loading zones, docking, and refueling/charging facilities for a range of vehicles;
- Block/street/pier level with coordination of sets of buildings and shared systems to adjust larger mobility events, disruptions. Examples include creating temporary landing, parking, maintenance sites or adaptable staging or recovery areas where mobile systems can meet dynamic demand;
- City level for city-wide accommodations to increase overall systems-of-systems efficiencies or adaptations to deal with emergencies and/or large-scale, unique events.
Mobility Traffic Management Systems & Services
Historic Traffic Management Drivers
In terms of traditional transportation, a key feature, for safety and efficiency reasons, has been the implementation of traffic management control signage and active flow control systems. Traffic management is usually located in either areas of high density or where active right of ways need to be provided. Examples of these are surface streets with traffic lights, stops signs, or buoys in harbors, or airport & ramp towers using surface markers and digital systems to control local aircraft operations and flows. Typically, where there’s low density or very complex individual operations we rely on humans to provide safe separation and integration. Examples are farms, warehouses, construction sites, open oceans, and visual flight rules with general aviation.

New Mobility Management Systems
Figure 6 and Figure 8 depict the multiple layers of interactions of disparate mobility systems that will need to operate in an ever changing, overlapping, multi systems-of-systems environments. Local coordinated operations will need to be able to be spontaneously created as demand requires for occurrences with dense, multiple operators executing their responsibilities at: accident scenes, protests, social celebrations and other episodic locations and events that will require high levels of coordination and collaboration. To support these increasingly autonomous systems capabilities we’ll need a mobility traffic management systems and services will need to allow for:
- Systems to work freely, seamlessly moving from autonomous to highly coordinated mobility operations;
- Operations in dense, multi system locations with overlapping areas of control and coordination between disparate operators and missions;
- Coordinated, dynamic teaming systems in various custom configurations, swarms, and flock like assemblies;
- The ability to move in out of various environments seamlessly (inside and outside of buildings, inside and outside systems/systems-of-systems); and
- The ability to do coordinated graceful degradation for off-nominal conditions.
And as depicted in the Figure 6 and Figure 8 the management environments will range from micro locations: inside buildings, ducts, piping to external building operations, to coordinated block size activities, and upto: coordinated city, region, national and international operations. These operations will need to be integrated through the Smart Cities Network Mesh to provide status, configuration, and coordination information for successful, safe, and efficient mobility operations.
Case Studies
There are several examples around the world [5] where cities and regions have successfully integrated various forms of transportation and mobility to provide seamless, efficient, and sustainable systems for their residents and visitors.
- Copenhagen, Denmark: Copenhagen is widely recognized as a global leader in sustainable urban mobility. The city has integrated cycling infrastructure with public transit, allowing commuters to ride bikes to train stations and take them on the train, reducing the need for private car usage. The city's "green wave" system [6] also optimizes traffic signals for cyclists during peak hours, further encouraging this form of transit.
- Curitiba, Brazil: Curitiba has developed an efficient and effective bus rapid transit (BRT) system that has been replicated in many cities worldwide. The system uses dedicated bus lanes to provide high-speed, reliable service. Moreover, the system is fully integrated with the city's land use and development plans.
- Singapore: The city-state has a highly integrated and efficient public transportation system, consisting of Mass Rapid Transit (MRT), Light Rail Transit (LRT), buses, and taxis. Their Electronic Road Pricing (ERP) system reduces traffic congestion by charging vehicles based on when and where they use the roads. Meanwhile, the Park & Ride scheme encourages drivers to park their cars at designated car parks and use public transport.
- Portland, Oregon, USA [7] : The city's transport authority, TriMet, offers integrated ticketing for buses, light rail, and commuter rail through a single card, called Hop Fastpass. Users can also use their smartphones to pay for rides, enhancing the convenience of multimodal travel.
- Tokyo, Japan: Tokyo is renowned for its extensive and efficient public transportation network, which includes subways, buses, and the world-famous Shinkansen bullet trains. Tokyo's transit card, Suica, can be used across these services and even in other parts of the country, making it a great example of fare integration.
- Paris, France: Paris boasts a variety of transportation modes, including Metro, RER suburban trains, buses, trams, and Velib' bike-sharing. All of these services are integrated into a single ticketing system. Moreover, the Autolib' electric car sharing service was a remarkable initiative towards sustainable mobility, which is now replaced by other car-sharing services after Autolib's termination in 2018.
These examples demonstrate how the integration of different modes of transport, supported by comprehensive planning and policy, can contribute to creating more livable, sustainable, and efficient urban environments.
Research Development & Integration
Smart buildings are at the nexus of these new mobility modes and operations. They are usually either the starting and/or end points of a given set of mobility operations. Given the broad scope of these interactions a private/public partnership is the ideal way to develop standards, identify technology challenges and work the various policy and guidelines needed to help insure a smooth, safe, and efficient evolution of new mobility capabilities integrated with smart buildings.
It is recommended that several federal agencies and communities of practice coordinate their activities in this area to maximize society’s investments in these areas. Below is an initial, but by no means exhaustive list of initiatives and organizations that would benefit from strategic collaboration on mobility operations for smart buildings:
- Global Cities Teams Challenge (GCTC)
- GCTC Transportation SuperCluster (TSC) & Blueprint
- GCTC Wireless SuperCluster (WSC) & Blueprint
- Networking and Information Technology Research & Development Program
- Computing-Enable Networked Physical Systems (CNPS)
- Intelligent Robotics and Autonomous Systems (IRAS)
- Department of Transportation (DoT) Intelligent Transportation Systems (ITS)
- U.S. Department of Commerce, National Telecommunications and Information Administration
- NASA Urban Air Mobility (UAM) Ecospheres Working Groups
- Association for Unmanned Vehicle Systems International (AUVSI)
- Others
Conclusion
The evolution of transportation and the current rapid increase of new modes of mobility is symbiotic with new thinking of the design and build of the built environment (municipalities and buildings) – trends in each affects the other in the mutual transformation and adjustment to new requirements and new opportunities for the built environment. For example, zero carbon emissions goals are affecting changes in private car usage within a city, which in turn is affecting design of buildings to more easily accommodate ride share and electric power.
The benefits of integrating new mobility modes with smart buildings have many synergistic benefits that can be most rapidly accomplished through private/public partnerships maximizing the innovative aspects of industry with federal, state, and local standards, policies and guidelines efforts. Those efforts coupled with, and informing federal and state infrastructure initiatives as well as government research and development investments will help enrich our smart cities & communities making them better prepared to take on the challenges and opportunities of the future.
- ↑ Crossover utility vehicles have become the most popular light-duty vehicle type. Their increased robustness and flexibility comes at the cost of decreased fuel efficiency over regular passenger vehicles.
- ↑ 2017 National Household Travel Survey by the Federal Highway Administration (FHWA)
- ↑ Seattle to permanently close 20 miles of streets to traffic so residents can exercise and bike on them
- ↑ Every Street In Paris To Be Cycle-Friendly By 2024, Promises Mayor
- ↑ Concept developed at the 2018 Global Cities Team Challenges Conference, Washington, D.C.
- ↑ Copenhagenize Design Co.