Floods: Difference between revisions
No edit summary |
No edit summary |
||
| Line 6: | Line 6: | ||
|sector=Buildings, Public Safety | |sector=Buildings, Public Safety | ||
|summary===Floods | |summary===Floods== | ||
The intensity of extreme rainfall has “sharply” increased over the past 20 years. While floods can be more regional in nature, satellite data show hydroclimatic extreme events are increasing in frequency, duration, and extent under warming conditions. Warmer temperatures increase evaporation, putting more moisture into the atmosphere that then gets released as rain or snowfall. It is also expected that, as the climate warms, flash floods will get “flashier,” meaning that the timing of the floods will get shorter while the magnitude gets higher. | The intensity of extreme rainfall has “sharply” increased over the past 20 years. While floods can be more regional in nature, satellite data show hydroclimatic extreme events are increasing in frequency, duration, and extent under warming conditions. Warmer temperatures increase evaporation, putting more moisture into the atmosphere that then gets released as rain or snowfall. It is also expected that, as the climate warms, flash floods will get “flashier,” meaning that the timing of the floods will get shorter while the magnitude gets higher. | ||
Revision as of 20:30, August 4, 2023
| Public Safety | |
|---|---|

| |
| Sectors | [[{{{sectors}}}]] "{{{sectors}}}" is not in the list (Buildings, Cybersecurity and Privacy, Data, Education, Public Safety, Rural, Smart Region, Transportation, Utility, Wellbeing, ...) of allowed values for the "Has sector" property. |
| Contact | Jiri Skopek |
| Topics | |
- Authors
Floods
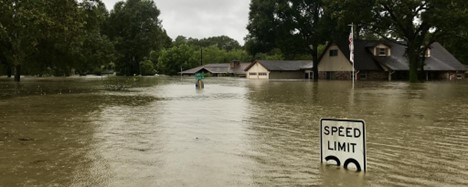
The intensity of extreme rainfall has “sharply” increased over the past 20 years. While floods can be more regional in nature, satellite data show hydroclimatic extreme events are increasing in frequency, duration, and extent under warming conditions. Warmer temperatures increase evaporation, putting more moisture into the atmosphere that then gets released as rain or snowfall. It is also expected that, as the climate warms, flash floods will get “flashier,” meaning that the timing of the floods will get shorter while the magnitude gets higher.
For the cities and communities affected by flooding the prime concerns are multifaceted. The most obvious is the physical safety of the population. Rapidly rising waters can endanger lives, especially if floods strike with little warning. The dangers are not only during the event but also afterwards, due to potentially hazardous materials brought in or spread by the floodwaters. Flooding can lead to soil erosion and loss of habitats, potentially endangering local ecosystems and biodiversity. Sustained flooding and repeated inundation can cause serious damage to infrastructure such as roads, bridges, buildings, and utilities, hampering transport, the supply of essentials, and emergency response capabilities. Frequent floods can render some areas unsuitable for housing. This could lead to the displacement of residents, who may face difficulties in finding new homes and jobs. The stress and trauma associated with losing one's home or livelihood can have serious mental health impacts on affected individuals. Flooding can disrupt local businesses, causing economic damage and job losses. Damage to agricultural land can also impact the food supply. There is also a danger to public health. Flood waters often contain hazardous materials, which can pose a public health risk. Moreover, standing water after a flood can become a breeding ground for mosquitoes and other disease vectors. In light of these concerns, it's vital to develop and implement comprehensive flood risk management strategies, which could include infrastructure improvements, zoning changes, flood warning systems, community education, and measures to mitigate the impact of climate change.
Monitoring and Benchmarking Extreme Floods- KPIs https://unalab.eu/system/files/2020-02/d31-nbs-performance-and-impact-monitoring-report2020-02-17.pdf
Total Precipitation - Metric: (days) is the most obvious indicator of the amount of rain. NOAA National Centers for Environmental Information https://www.ncei.noaa.gov/access/monitoring/climate-at-a-glance/global/mapping provides detailed information on both local and global total precipitation. The USGS national Water Data System https://waterdata.usgs.gov/nwis also provides access to real-time water data. EPA Climate Change Indicators: River Flooding https://www.epa.gov/climate-indicators/climate-change-indicators-river-flooding examines changes in the size and frequency of inland river flood events in the United States as well as coastal flooding https://www.epa.gov/climate-indicators/climate-change-indicators-coastal-flooding .
Flood Peak Height-Metric: (Height and time to flood peak) The peak flow is the maximum value of the flowrate due to a given rain event. Peak flow variation is defined by the relative error in peak flow between the peak flow of the catchment where the project intervention is located and the peak flow of a catchment without the intervention. This indicator can be calculated as the average value of a sample of peak flows deduced from a rain/runoff time series (typically one year) and may be obtained with observed runoff or simulated runoff.
Stormwater run-off- Metric: ( mm/%) A significant consequence of impermeable surfaces in urban areas is greater runoff, which can also lead to flooding. . Many factors are affecting the quantity of surface runoff, including soil characteristics, land use and vegetative cover, hillslope, and storm properties such as rainfall duration, amount, and intensity. Different methods for quantifying runoff include direct measurement, the curve number method, the rational method, the use of intensity-duration-frequency (IDF) curves, and process-based hydraulic modelling.
WDT - Water Detention Time- Metric: (hr) can measure increased infiltration. The detention time corresponds to the theoretically calculated time required for a given amount of water to flow from a given area to another area at a given flow rate. Areas exposed to flooding Metric: (ha) Flood maps and monitoring data such as the EPA Climate Change Indicators can identify areas affected by flooding.


