Digital Twin: Infectious Disease Management
| Digital Twin: Infectious Disease Management | |
 Infectious Disease Management | |
| Team Organizations | Digital Twin Consortium Axomem |
| Point of Contact | Karen Quatromoni |
| Participating Municipalities | Boston MA |
| Sectors | Data |
| Initiative | |
| Status | Concept only Stage |
| Last Updated | February 1, 2026 |
Summary
Link time, spatial and sensor data with existing enterprise data to enable new insights.
- Objective
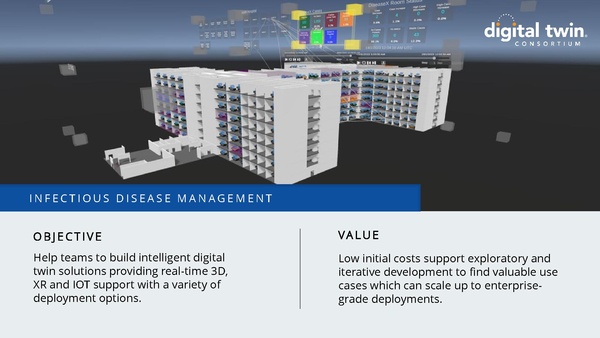
Help teams to build intelligent digital twin solutions providing real-time 3D, XR and IOT support with a variety of deployment options.
- Value
Low initial costs support exploratory and iterative development to find valuable use cases which can scale up to enterprisegrade deployments.
- The Solution
The Axomem Axoverse is a vertically integrated digital twin platform. It enables real-time data integration and 3D visualization on low-cost infrastructure. It provides low-level IOT sensing through to XR visualization, modularized via APIs to enable composability with 3rd party components.
- Digital Twin Role
Link time, spatial and sensor data with existing enterprise data to enable new insights. This helps organizations better understand and predict the physical world in which they operate.
- Benifits & Intended Results
Allow organizations to start small experimental use cases with low investment, iterate quickly, prove results. Use those results to scale up to realize value with enterprise-level integration and security.
- Visualization of Current Disease Spread
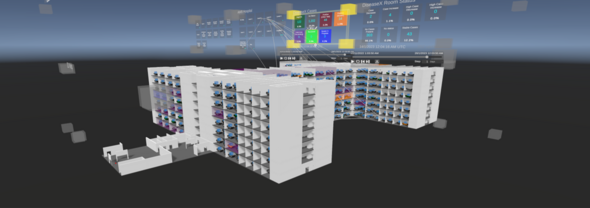
Epidemiologists get an up-to-date view of the state of disease spread across more than 1,700 inpatients in 6 blocks across the campus, linking existing enterprise data sources with interactive 3D visualizations.
- Visual Time Slicing to Understand Progression and Trends
Users can move a time slicer across 12+ months of data to see patient movements between beds along with their current and future disease state, providing an unprecedented level of contact tracing and investigation.
- Risk Quantification, Prediction and Notifications
A risk quantification and prediction algorithm now uses both exposure time and spatial distance to better predict likely secondary infections to better prioritize screening targets. Further integrations and notifications are in development.
