City Insight Platform- Communities in Context: Difference between revisions
No edit summary |
No edit summary |
||
| (4 intermediate revisions by the same user not shown) | |||
| Line 1: | Line 1: | ||
{{ActionCluster | {{ActionCluster | ||
|image=NYCConnectedCommunities.jpeg | |||
| | |team=Vizalytics, Amazon | ||
|leader=Aileen Gemma Smith | |||
| team | |imagecaption=Connected Communities | ||
|municipalities=New York NY | |||
| leader | |status=Launched | ||
|website=https://www1.nyc.gov/assets/nycha/downloads/pdf/Connected-Communities-Guidebook.pdf | |||
|download=Connected-Communities-Guidebook.pdf | |||
| imagecaption | |description=Using data from the city, state and federal level Vizalytics will create a City Insight Platform. | ||
| municipalities | This will provide users with a real-time view of what is happening in a neighborhood, and can be refined by choosing which lens to view- from socio-economic indices, business climate, transportation, infrastructure, quality of life and more. | ||
|challenges=Too much data in too many siloes, and limited expertise to look beyond one agency view. This is a problem quickly increasing in density and as more data, such as from sensors is available, cities need to have solutions that are focused across different types and sources of information and not silo-ed to a single agency. | |||
| status | |solutions=Vizalytics will scale the work done with neighborhoods.nyc into a city-wide platform that is meant for city agency officials to have a real time view across multiple agency data to understand communities in context and the risks they face. | ||
| website | |requirements=* Content Audit | ||
| download | |||
| description | |||
Using data from the city, state and federal level Vizalytics will create a City Insight Platform. | |||
This will provide users with a real-time view of what is happening in a neighborhood, and can be refined by choosing which lens to view- from socio-economic indices, business climate, transportation, infrastructure, quality of life and more. | |||
| challenges | |||
Too much data in too many siloes, and limited expertise to look beyond one agency view. This is a problem quickly increasing in density and as more data, such as from sensors is available, cities need to have solutions that are focused across different types and sources of information and not silo-ed to a single agency. | |||
| solutions | |||
Vizalytics will scale the work done with neighborhoods.nyc into a city-wide platform that is meant for city agency officials to have a real time view across multiple agency data to understand communities in context and the risks they face. | |||
| requirements | |||
* Content Audit | |||
* Content Cleanup- normalization and deduplication | * Content Cleanup- normalization and deduplication | ||
* Creation of ontology and taxonomies | * Creation of ontology and taxonomies | ||
* Content Enrichment | * Content Enrichment | ||
* Develop targeted data visualization and interactions on the Vizalytics Knowledge Graph platform | * Develop targeted data visualization and interactions on the Vizalytics Knowledge Graph platform | ||
|kpi=* Time to find, obtain and integrate inter-agency data reduced by 50% | |||
| kpi | |||
* Time to find, obtain and integrate inter-agency data reduced by 50% | |||
* 35% increase in internal cross-agency data use | * 35% increase in internal cross-agency data use | ||
* 20% increase in outreach programs that leverage data derived from multiple agencies | * 20% increase in outreach programs that leverage data derived from multiple agencies | ||
|measurement=* Direct measures of data search, retrieval and integration vs. current manual processes, both internal and inter-agency. | |||
| measurement | |||
* Direct measures of data search, retrieval and integration vs. current manual processes, both internal and inter-agency. | |||
* Historical analysis of inter-agency data use (currently MOA-driven) in external facing programs. | * Historical analysis of inter-agency data use (currently MOA-driven) in external facing programs. | ||
|standards=* As much of the data is from disparate sources, and is classified in different ways, the more integration into our taxonomy and ontologies, the easier it becomes to work with more data sets and agencies at scale. | |||
| standards | |||
* As much of the data is from disparate sources, and is classified in different ways, the more integration into our taxonomy and ontologies, the easier it becomes to work with more data sets and agencies at scale. | |||
* Vizalytics’ city-agnostic spatio-temporal knowledge graph, standardizes the data it ingests and combines. Practically, this means that bringing a data source or even a new city into the system requires only mapping to the standard KG city schema, allowing for easy replication. When new relationships and understandings are created, they are immediately available for all integrated cities. | * Vizalytics’ city-agnostic spatio-temporal knowledge graph, standardizes the data it ingests and combines. Practically, this means that bringing a data source or even a new city into the system requires only mapping to the standard KG city schema, allowing for easy replication. When new relationships and understandings are created, they are immediately available for all integrated cities. | ||
|cybersecurity=TBD | |||
| cybersecurity | |impacts=Streamlining access to exiting data and bringing together disparate data sets in ways that provide access to real insight without the need for data analytics skills will increase the ability for city agencies and officials to make accurate and constructive decisions without weeks of searching and without having to engage high demand data analytics resources. | ||
|demonstration=* Clickable prototype to facilitate concept development | |||
| impacts | |||
Streamlining access to exiting data and bringing together disparate data sets in ways that provide access to real insight without the need for data analytics skills will increase the ability for city agencies and officials to make accurate and constructive decisions without weeks of searching and without having to engage high demand data analytics resources. | |||
| demonstration | |||
* Clickable prototype to facilitate concept development | |||
* Limited data functional prototype for initial deployment | * Limited data functional prototype for initial deployment | ||
|chapter=Open Data | |||
| supercluster | |supercluster=Data | ||
| year | |year=2017 | ||
|title=City Insight Platform- Communities in Context | |||
|email=Aileen@vizalytics.com | |||
}} | }} | ||
Latest revision as of 21:41, January 24, 2023
| City Insight Platform- Communities in Context | |
|---|---|

| |
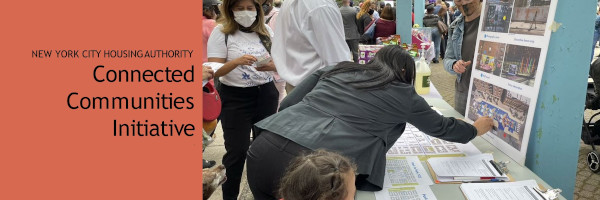
 Connected Communities | |
| Team Organizations | Vizalytics Amazon |
| Team Leaders | Aileen Gemma Smith |
| Participating Municipalities | New York NY |
| Status | Launched |
| Document | 
|
Description
Using data from the city, state and federal level Vizalytics will create a City Insight Platform. This will provide users with a real-time view of what is happening in a neighborhood, and can be refined by choosing which lens to view- from socio-economic indices, business climate, transportation, infrastructure, quality of life and more.
Challenges
Too much data in too many siloes, and limited expertise to look beyond one agency view. This is a problem quickly increasing in density and as more data, such as from sensors is available, cities need to have solutions that are focused across different types and sources of information and not silo-ed to a single agency.
Solutions
Vizalytics will scale the work done with neighborhoods.nyc into a city-wide platform that is meant for city agency officials to have a real time view across multiple agency data to understand communities in context and the risks they face.
Major Requirements
- Content Audit
- Content Cleanup- normalization and deduplication
- Creation of ontology and taxonomies
- Content Enrichment
- Develop targeted data visualization and interactions on the Vizalytics Knowledge Graph platform
Performance Targets
| Key Performance Indicators (KPIs) | Measurement Methods |
|---|---|
|
|
Standards, Replicability, Scalability, and Sustainability
- As much of the data is from disparate sources, and is classified in different ways, the more integration into our taxonomy and ontologies, the easier it becomes to work with more data sets and agencies at scale.
- Vizalytics’ city-agnostic spatio-temporal knowledge graph, standardizes the data it ingests and combines. Practically, this means that bringing a data source or even a new city into the system requires only mapping to the standard KG city schema, allowing for easy replication. When new relationships and understandings are created, they are immediately available for all integrated cities.
Cybersecurity and Privacy
TBD
Impacts
Streamlining access to exiting data and bringing together disparate data sets in ways that provide access to real insight without the need for data analytics skills will increase the ability for city agencies and officials to make accurate and constructive decisions without weeks of searching and without having to engage high demand data analytics resources.
Demonstration/Deployment
- Clickable prototype to facilitate concept development
- Limited data functional prototype for initial deployment