Smart and Accessible Transportation Hub: Difference between revisions
No edit summary |
No edit summary |
||
| Line 1: | Line 1: | ||
{{ActionCluster | {{ActionCluster | ||
|image=Passaic County.jpg | |||
| | |team=CUNY City College, Rutgers University, Lighthouse Guild | ||
| team | |leader=Zhigang Zhu | ||
|imagecaption=Accessible Transportation | |||
| leader | |municipalities=Passaic NJ<!-- ; NJ Transit; NYC Mayor's Office for People with Disabilities (MOPD); NYS Commission for the Blind (NYSCB) --> | ||
|status=Ready for Public Announcement | |||
|website=https://youtu.be/_hxdXqTVG7I | |||
|description=This GCTC Team aims to systematically investigate a novel cyber-physical infrastructure framework that can effectively and efficiently transform existing transportation hubs into smart facilities. The Smart Hub is capable of providing better location-awareness services (e.g. finding terminals, improving travel experience, obtaining security alters) to the traveling public, especially for the underserved populations including those with visual impairment, Autism Spectrum Disorder (ASD), or simply navigation challenges. | |||
| imagecaption | |solutions=* Relative localization of mobile devices with Bluetooth connections which generate a locally connected graph (mobile graph). | ||
| municipalities | |||
<!-- ; NJ Transit; NYC Mayor's Office for People with Disabilities (MOPD); NYS Commission for the Blind (NYSCB) --> | |||
| status | |||
| website | |||
| description | |||
This GCTC Team aims to systematically investigate a novel cyber-physical infrastructure framework that can effectively and efficiently transform existing transportation hubs into smart facilities. The Smart Hub is capable of providing better location-awareness services (e.g. finding terminals, improving travel experience, obtaining security alters) to the traveling public, especially for the underserved populations including those with visual impairment, Autism Spectrum Disorder (ASD), or simply navigation challenges. | |||
| solutions | |||
* Relative localization of mobile devices with Bluetooth connections which generate a locally connected graph (mobile graph). | |||
* Registration of the dynamic mobile graph with the 3D model of the environment at various levels using both visual and digital designs. | * Registration of the dynamic mobile graph with the 3D model of the environment at various levels using both visual and digital designs. | ||
* Optimized and customized feedback to users in a crowded environment using the semantic 3D model, the crowd analysis results and the bus schedule information | * Optimized and customized feedback to users in a crowded environment using the semantic 3D model, the crowd analysis results and the bus schedule information | ||
|requirements=* Develop and assemble project team | |||
| requirements | |||
* Develop and assemble project team | |||
* Create scope and requirements and a project plan | * Create scope and requirements and a project plan | ||
* Design system architecture with both stationary and mobile nodes | * Design system architecture with both stationary and mobile nodes | ||
| Line 34: | Line 18: | ||
* Gain stakeholder support esp. PANYNJ and buy-in from the community | * Gain stakeholder support esp. PANYNJ and buy-in from the community | ||
* Run pilot for two months | * Run pilot for two months | ||
|kpi=* Average time to find a terminal reduced by ~50% | |||
| kpi | |||
* Average time to find a terminal reduced by ~50% | |||
* Increase of number of users with special needs ~25% | * Increase of number of users with special needs ~25% | ||
* User experience satisfaction increased by ~60% | * User experience satisfaction increased by ~60% | ||
|measurement=* Measure navigation time in minutes over 3-6 month period, compared to baseline. | |||
| measurement | |||
* Measure navigation time in minutes over 3-6 month period, compared to baseline. | |||
* Measure number of people downloading and using the apps | * Measure number of people downloading and using the apps | ||
* Questionnaires to measure user experience in terms of navigation, waiting times, and safety concerns. | * Questionnaires to measure user experience in terms of navigation, waiting times, and safety concerns. | ||
|standards=* Requires interoperable WiFi, Bluetooth and 3D model interfaces. | |||
| standards | |||
* Requires interoperable WiFi, Bluetooth and 3D model interfaces. | |||
* Establishes standardized procedures for location-aware services. | * Establishes standardized procedures for location-aware services. | ||
* Standardized processes are not unique to city or region and can be replicated and scaled up in multiple cities/communities. The solution is planned and designed to be replicated in 2 transportation hubs in the New York City area. | * Standardized processes are not unique to city or region and can be replicated and scaled up in multiple cities/communities. The solution is planned and designed to be replicated in 2 transportation hubs in the New York City area. | ||
* The system will have its own business model to create sustainable revenue stream. | * The system will have its own business model to create sustainable revenue stream. | ||
|impacts=* Improve efficiency of big transportation hubs | |||
| impacts | |||
* Improve efficiency of big transportation hubs | |||
* Improve quality of life for persons with visual impairments and/or ASDs, among others | * Improve quality of life for persons with visual impairments and/or ASDs, among others | ||
* Improve travel safety and user experience in crowded environments | * Improve travel safety and user experience in crowded environments | ||
|demonstration=* Phase I Pilot/Demonstration June 2016: | |||
| demonstration | |||
* Phase I Pilot/Demonstration June 2016: | |||
A demonstration system in small scale in a campus building for providing users travel guidance. Videos and visual demos to show the 3D modeling, crowd detection, and preliminary user localization. | A demonstration system in small scale in a campus building for providing users travel guidance. Videos and visual demos to show the 3D modeling, crowd detection, and preliminary user localization. | ||
* Phase II Deployment June 2017: | * Phase II Deployment June 2017: | ||
A demonstration system in a transportation station in the New York City area for providing users travel guidance. Videos and visual demos to show the 3D modeling, crowd detection, and user localization and navigation assistance. | A demonstration system in a transportation station in the New York City area for providing users travel guidance. Videos and visual demos to show the 3D modeling, crowd detection, and user localization and navigation assistance. | ||
|tag=Mobility Hub | |||
| supercluster | |supercluster=Transportation | ||
| year | |year=2017 | ||
| | |title=Smart and Accessible Transportation Hub | ||
|email=zhu@cs.ccny.cuny.edu | |||
<!-- [mailto:jg931@rci.rutgers.edu Jie Gong] --> | |||
}} | }} | ||
[[Category:Year_2016]] | [[Category:Year_2016]] | ||
Revision as of 04:15, March 25, 2022
| Smart and Accessible Transportation Hub | |
|---|---|

| |
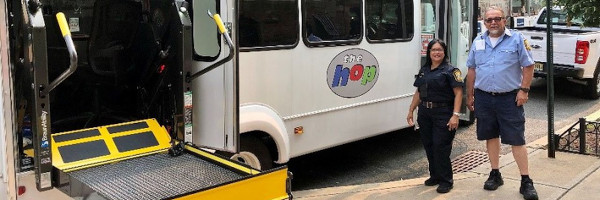
 Accessible Transportation | |
| Team Organizations | CUNY City College Rutgers University Lighthouse Guild |
| Team Leaders | Zhigang Zhu |
| Participating Municipalities | Passaic NJ |
| Status | Ready for Public Announcement |
| Document | None |
Description
This GCTC Team aims to systematically investigate a novel cyber-physical infrastructure framework that can effectively and efficiently transform existing transportation hubs into smart facilities. The Smart Hub is capable of providing better location-awareness services (e.g. finding terminals, improving travel experience, obtaining security alters) to the traveling public, especially for the underserved populations including those with visual impairment, Autism Spectrum Disorder (ASD), or simply navigation challenges.
Challenges
{{{challenges}}}
Solutions
- Relative localization of mobile devices with Bluetooth connections which generate a locally connected graph (mobile graph).
- Registration of the dynamic mobile graph with the 3D model of the environment at various levels using both visual and digital designs.
- Optimized and customized feedback to users in a crowded environment using the semantic 3D model, the crowd analysis results and the bus schedule information
Major Requirements
- Develop and assemble project team
- Create scope and requirements and a project plan
- Design system architecture with both stationary and mobile nodes
- Develop mobile applications for mobile graph localization
- Register the mobile graph with the 3D model; design and roll out pilot
- Gain stakeholder support esp. PANYNJ and buy-in from the community
- Run pilot for two months
Performance Targets
| Key Performance Indicators (KPIs) | Measurement Methods |
|---|---|
|
|
Standards, Replicability, Scalability, and Sustainability
- Requires interoperable WiFi, Bluetooth and 3D model interfaces.
- Establishes standardized procedures for location-aware services.
- Standardized processes are not unique to city or region and can be replicated and scaled up in multiple cities/communities. The solution is planned and designed to be replicated in 2 transportation hubs in the New York City area.
- The system will have its own business model to create sustainable revenue stream.
Cybersecurity and Privacy
{{{cybersecurity}}}
Impacts
- Improve efficiency of big transportation hubs
- Improve quality of life for persons with visual impairments and/or ASDs, among others
- Improve travel safety and user experience in crowded environments
Demonstration/Deployment
- Phase I Pilot/Demonstration June 2016:
A demonstration system in small scale in a campus building for providing users travel guidance. Videos and visual demos to show the 3D modeling, crowd detection, and preliminary user localization.
- Phase II Deployment June 2017:
A demonstration system in a transportation station in the New York City area for providing users travel guidance. Videos and visual demos to show the 3D modeling, crowd detection, and user localization and navigation assistance.