Focus Areas
Jump to navigation
Jump to search
GCTC Organization and Technology Focus Areas
- Transportation systems, vehicles, and autonomy
- (adding cross-over topics Parking, Lidar, road systems/ODOT, trenching for broadband, charging stations, rights of way)
- Data governance and city data platforms and dashboards
- Public utilities for energy, water and waste management
- might this now (or soon) include broadband (perhaps management / oversight / policy)
- Wireless communications and broadband applications (perhaps from the perspective of technologies / data / data management)
- Cybersecurity and privacy for public and private sectors
- Public safety/security and communications
- Community resilience, adaptability and sustainability
- Agriculture and rural productivity and quality of life
- Smart building technologies and IoT applications (perhaps now with “Building” as a verb and including community engagement / Computer-Human Interface Design / UX
- Education and workforce development (Covering the Education industry (vertical) as well as serving as the outreach / education / communications arm for GCTC generally (horizontal) as we have not had a Marketing/Communications *function; Has also been the seat of “Community Engagement” topic)
- Smart Regions and collaboration strategies (Does “collaboration strategies” refer to techniques, technologies, processes, governance?)
- Community well-being, ethics, integrity, and trust (Was “Thriving Communities” coupled with “DEI”)
QUESTIONS: WHAT’S MISSING – WHERE ARE THE GAPS, WHERE ARE THE OTHER OVERLAPS, WHAT ARE THE HANDOFFS BETWEEN FOCUS AREAS, HOW IS OR SHOULD BE THE WORK INTEGRATED
- Safety and community resilience issues
- Start with key performance indicators of a city
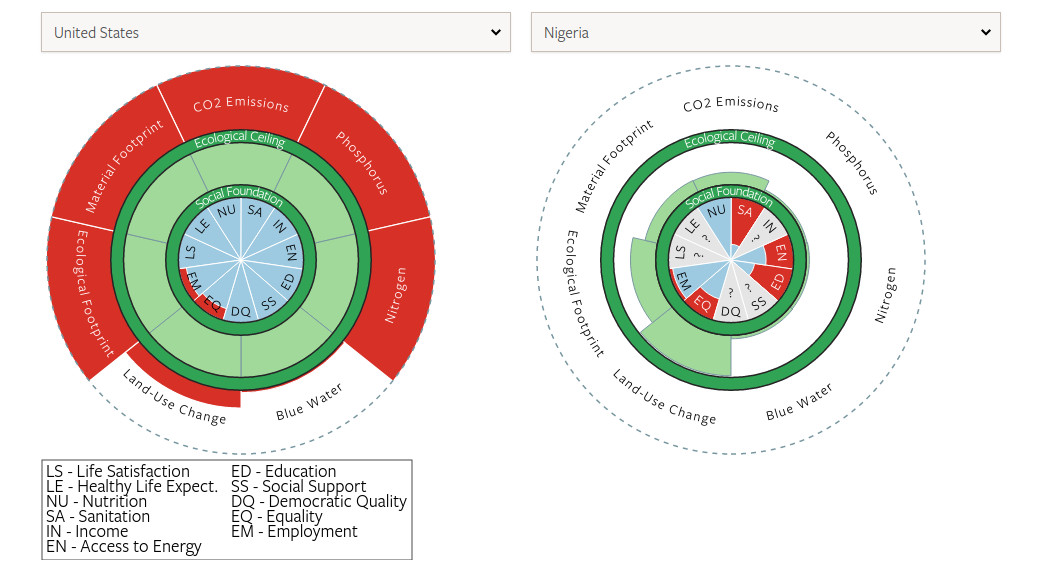
Key Indicators
Blue wedges show social performance relative to a threshold associated with meeting basic needs. Green wedges show resource use relative to a biophysical boundary associated with sustainability. Red wedges show shortfalls below the social threshold or overshoot beyond the biophysical boundary, while grey wedges show indicators with missing data. Wedges with a dashed edge extend beyond the chart area. Ideally a country would have blue wedges that reach the social foundation and green wedges within the ecological ceiling. See the tables below for country-specific details.
| Social Indicator | United Kingdom | Sri Lanka | Per Capita Boundary | Threshold Unit |
|---|---|---|---|---|
| Life Satisfaction | 6.9 | 4.2 | 6.5 | [0-10] Cantril scale |
| Healthy Life Expect. | 71 | 64 | 65 | years of healthy life |
| Nutrition | 3414 | 2488 | 2700 | kilocalories per capita per day |
| Sanitation | 100 | 91.1 | 95 | % with access to improved sanitation |
| Income | 100 | 98.3 | 95 | % who earn above $1.90 per day |
| Access to Energy | 100 | 88.7 | 95 | % with access to electricity |
| Education | 92.8 | 99.1 | 95 | % enrolment in secondary school |
| Social Support | 94.9 | 84.2 | 90 | % with friends or family they can depend on |
| Democratic Quality | 0.8 | -0.6 | 0.8 | Democratic Quality Index |
| Equality | 65.2 | 58.5 | 70 | [0-100] Scale -> (1 - Gini Index) * 100 |
| Employment | 92.2 | 95.8 | 94 | % of labour force employed |
| Biophysical Indicator | United Kingdom | Sri Lanka | Per Capita Boundary | Unit |
|---|---|---|---|---|
| CO2 Emissions | 12.1 | 1.1 | 1.6 | tonnes CO2 per year |
| Phosphorus | 5.2 | 0.1 | 0.9 | kilograms P per year |
| Nitrogen | 72.9 | 1.9 | 8.9 | kilograms N per year |
| Blue Water | 240 | 405 | 574 | cubic metres H2O per year |
| Land Use (eHANPP) | 2.4 | 1.5 | 2.6 | tonnes C per year |
| Ecological Footprint | 4.2 | 1.2 | 1.7 | global hectares (gha) per year |
| Material Footprint | 24.3 | 3.2 | 7.2 | tonnes per year |