Energy Working Group Framework Best Practices
The big idea is, we believe our SuperCluster Leadership Team will not decide the fate of energy innovation in our world, we believe that we all will. To this end we aim to achieve together:
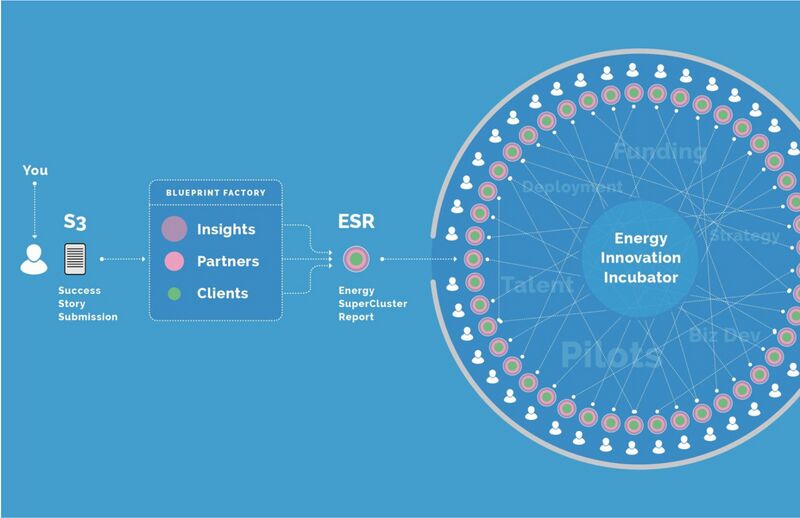
- A collection of Success Story Submissions (S3) of energy innovation projects from across the world to identify patterns, themes, lessons and practices that get shared publicly as a Living Blueprint, in addition to exporting Energy SuperCluster Reports (ESR) back to members who submit S3s.
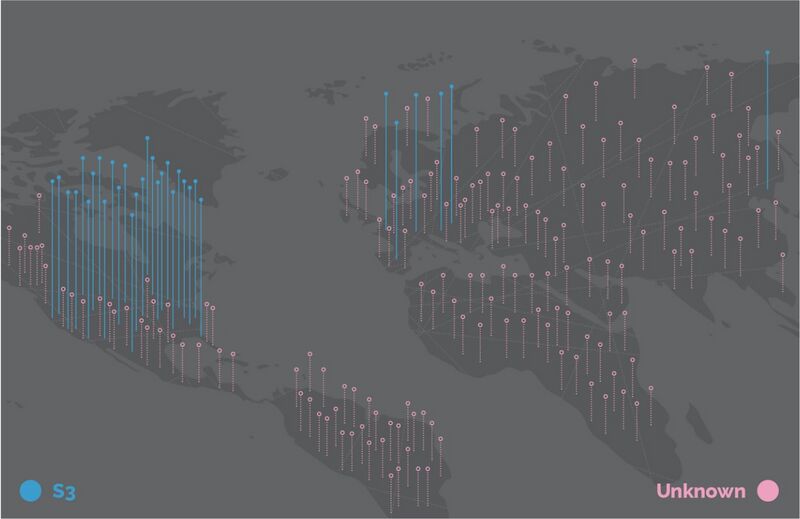
- Success Story Submissions (S3) totaling (100) by December 31st, 2017, (250) by end of 2018, and (500) by end of 2019. To this date (August 24th, 2017), we have a total of (45) S3s collected.
- An Average Scalability Factor of 25x by 2019 compared to the current Average Scalability Factor of 2x based on the S3s collected.
- A model where projects are 75% revenue funded by 2019. According to our current S3s, 36% of energy innovation projects are grant funded, 27% privately funded, 15% city funded, and only 8% revenue funded.
- To grow the network of the deployment cities in our network from (28) cities to (100) cities by 2019 for energy innovation projects.
- To work with universities to have their students operate our SuperCluster.
- To work with partnering organizations and companies to create an automated platform for Success Story Submissions (S3), Matchmaking (MM) and Blueprinting.
Ingredients
Success Story Submission (S3)
An energy innovation project submission to the Energy SuperCluster to receive an Energy SuperCluster Report (ESR), join as an official member of our SuperCluster, and receive Matchmaking (MM) services to individuals and organizations in the network. Submit an S3 here: www.bit.ly/escs3
Energy SuperCluster Report (ESR)
A PDF document that submitters of Success Story Submissions (S3) receive that includes an exported format of their Organization Profile, Success Story, Insights Dashboard (ID), Partner Recommendations, Clients Referrals and Actions. View ESRs here: www.bit.ly/escpublic
Warm Introductions
Primary benefit of being a member of the SuperCluster by submitting a Success Story Submission (S3). The ability to request a warm introduction via email from our team to anyone in our network to spur discussion, opportunities and projects. Request a Warm Introduction here: www.bit.ly/escintro
Matchmaking (MM)
A system that encodes Success Story Submissions (S3) that match individuals and organizations together in the form of Partner Recommendations and Client Referrals.
Partner Recommendations
List of recommended partners within our network that is included in the Energy SuperCluster Report (ESR) that our Matchmaking (MM) system generated for you.
Client Referrals
List of potential clients within our network that is included in the Energy SuperCluster Report (ESR) that our Matchmaking (MM) system generated for you.
Insights Dashboard (ID)
A living reference guide derived from the Living Blueprint of energy project categories (Energy Efficiency, Internet of Things, Distributed Energy, etc) that compare your project data with similar projects in network.
Living Blueprint
A living guide (and whitepaper) aggregating processed, formatted and referenceable Success Story Submissions (S3) to create and share a wealth of energy innovation best practices, lessons learned and insights to the public.
Committees
Members of the SuperCluster that are selected to review formatted and aggregated Success Story Submissions (S3) to apply expertise on qualitative and quantitative data to generate an updated Living Blueprint referencing system. Apply to the Committees here: www.bit.ly/escteam
Cities & Policy Committee
Members that provide expertise on energy innovation as it applies to governmental functions, regulations, policy and other civic challenges.
Technology & Data Committee
Members that provide expertise on energy innovation as it applies to technology solutions, technical applications, data science and other technical challenges.
Finance & Business Model Committee
Members that provide expertise on energy innovation as it applies to financing projects, business model development, scalability and other monetary challenges.
Blueprint Factory
The complete blueprinting production system that includes all core functions such as the processing of Success Story Submissions (S3), Committees, Insights Dashboard (ID), Matchmaking (MM) System, and production of Energy SuperCluster Reports (ESR).
Mavens Team
Team members that recruit members to the SuperCluster via Success Story Submission (S3). Join the team here: www.bit.ly/escteam
Blue Team
Team members that process Success Story Submissions (S3), review data via Committees, produce Energy SuperCluster Report (ESR), match individuals and organizations through the Matchmaking (MM) system, and operate the entire SuperCluster. Join the team here: www.bit.ly/escteam
Connectors Team
Team members that deliver Energy SuperCluster Reports (ESR) to submitters of Success Story Submissions (S3) and make warm introductions to member requests. Serves also as a community manager. Join the team here: www.bit.ly/escteam
Energy Innovation Incubator
The definition of what our SuperCluster is with the purpose of advancing our network of energy innovators to spur market transformation of energy consumers to become energy prosumers towards a sustainable and resilient future in our world.
About the Energy SuperCluster
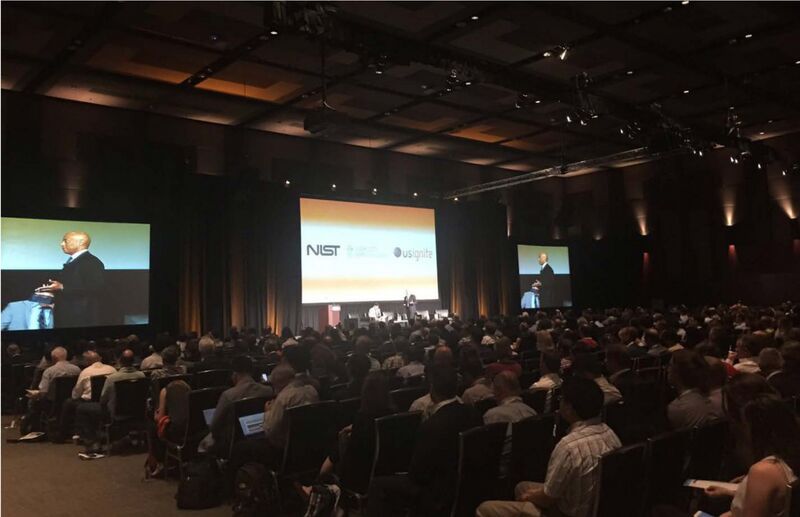
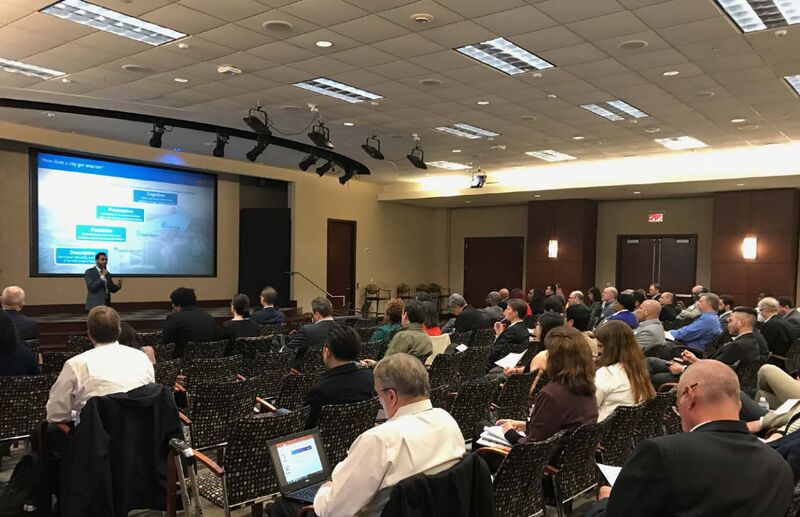
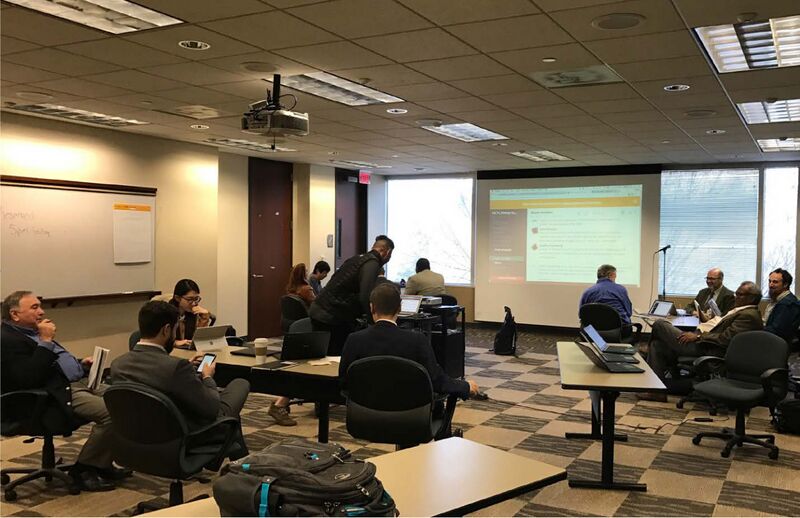
The Energy SuperCluster is embedded in the Utility SuperCluster of the NIST Global Cities Team Challenge (GCTC) Network. We are a cross-sector consortium of city governments, universities, industry leaders and community-based organizations on a mission to advance energy innovation in cities across the globe. Our SuperCluster believes our leadership team alone will not decide the fate of energy innovation in the world; we believe that we together will. In order to achieve this, our primary function is to recruit and collect Success Story Submissions (S3) of energy innovation projects from around the world. We process these success stories through our Blueprint Factory to create a referenceable data- driven Living Blueprint. Through this Living Blueprint, we include a review system by Committees, Insights Dashboard (ID) that compares and contrasts S3 projects with related success stories, and a Matchmaking (MM) system that recommends partners and clients within our network. The deliverable we send back to the individual or organization that submitted a Success Story Submission (S3) is an Energy SuperCluster Report (ESR) which includes the Insights Dashboard (ID), Partner Recommendations and Client Referrals. Once the ESR has been delivered, members can request warm introductions to anyone within our network that have also submitted S3s as a matchmaking service to spur discussion, opportunities and projects. The aim is to create more projects in our network to further understand best practices, increasing the scalability factor of energy innovation in our cities.
Leadership Team
As of August 24th, 2017, the current roster of organizations in our leadership team includes:
- AT&T
- City of Atlanta
- City of Portland
- City of San Leandro
- Clemson University
- Dekalb County
- Everimpact
- FIWARE
- Innovation Intelligence Institute
- InterInnov
- KC Digital Drive
- Lawrence Berkeley National Lab
- Maalka
- OSIsoft
- PilotCity
- Scalable Strategies
- The Green Link Group
- University of Georgia
- University of Tennessee
- US Department of Energy
- ZipPower
Our leadership team currently consists of (3) Sub-Teams and (3) Committees:
- Mavens Team
- Blue Team
- Connectors Team
- Cities & Policy Committee
- Technology & Data Committee
- Finance & Business Model Committee
- You can find the definitions of each team in the Ingredients section above.
Mavens Team
- Mike Mihuc, Market Principal, Academic R&D, OSIsoft
- Billy Malone, Environmental Energy Manager, Dekalb County
- Lusenii Watson, SolSmart Consultant, City of Atlanta
Blue Team
- Derick Lee, Chief Architect, PilotCity
- Caroline Hays, Fellow, City of San Leandro
- Tianzhen Hong, Principal Investigator, Lawrence Berkeley National Lab
- Paul Wertz, Client Solutions Executive, AT&T
- Taylor Hill, Student, University of Georgia
- Romney Cola, Fellow, PilotCity
- Guneet Bedi, PhD Student, Clemson University Connectors Team
- Géraldine Quetin, Senior Consultant, InterInnov / FIWARE
- Scott Pomeroy, President & CEO, Scalable Strategies
Cities & Policy Committee
- Chair: Billy Malone, Environmental Energy Manager, Dekalb County
- Deborah Acosta, Chief Innovation Officer, City of San Leandro
- Matt Cox, Co-Founder, The Green Link Group
- Aaron Deacon, Managing Director, KC Digital Drive
- Katherine Hambrick, Project Coordinator, KC Digital Drive Technology & Data Committee
- Chair: Rajendra Singh, Professor, Clemson University
- Harry Bergmann, Data Tools Fellow, US Department of Energy
- Mike Mihuc, Market Principal, Academic R&D, OSIsoft
- Tianzhen Hong, Principal Investigator, Lawrence Berkeley National Lab Technology & Data Committee
- Chair: Mathieu Carlier, CEO, Everimpact
- Rimas Gulbinas, CEO, Maalka
- John Teeter, Chief Innovation Officer, Maalka
Success Story Submission (S3)
The Success Story Submission (S3) is currently a Google Form that takes an average of 30 minutes to complete. It consists of questions with various response choices from short answers, long answers, multiple choice and checkboxes. Category areas of questions include:
- General Information
- Ecosystem
- Timeline
- Business Model
- Technology
- Data
- Policy
- Finances
- Impact
These category areas allow us to process the data from each in sections, with in turn allows us to format it for the Blueprint Factory to process. You can view the Success Story Submission (S3) here: www.bit.ly/escs3
Blueprint Factory
The Blueprint Factory is the system and mechanisms that currently process the S3s into digestible formats for each individual layer of applicable value: Committee Review, Insights Dashboard (ID), and Matchmaking (MM). This Blueprint Factory has a multitude of functions that are currently analog and has extreme potential to be automated to update the Living Blueprint, automated Matchmaking (MM), and instant Energy SuperCluster Report (ESR) production and delivery.
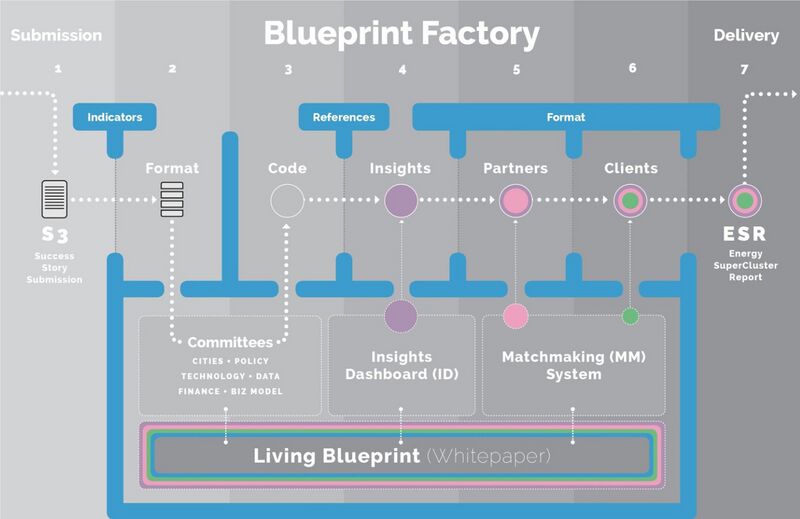
As you can see from the above diagram, the Blueprint Factory has a multitude of systems that format, code, reference, update and produce content in a living system. As S3s are submitted, the Living Blueprint will evolve, and become richer over time. This maturity will create a more established Committee, greater accuracy for the Insights Dashboard (ID) and a more robust Matchmaking (MM) System. In return, this will develop a stronger Energy SuperCluster Report (ESR) to be delivered straight back to the submitter of the S3.
Energy SuperCluster Report (ESR)
The ESR is currently a template in Adobe InDesign that can be exported into a PDF format to be emailed to the individual or organization that submitted a S3. The ESR’s standard content includes:
- Cover Page
- Table of Contents
- Organization Profile
- Success Story Profile
- Insights Dashboard (ID)
- Partner Recommendations
- Client Referrals
- Actions
You can see the Energy SuperCluster Report (ESR) Library here: www.bit.ly/escpublic.
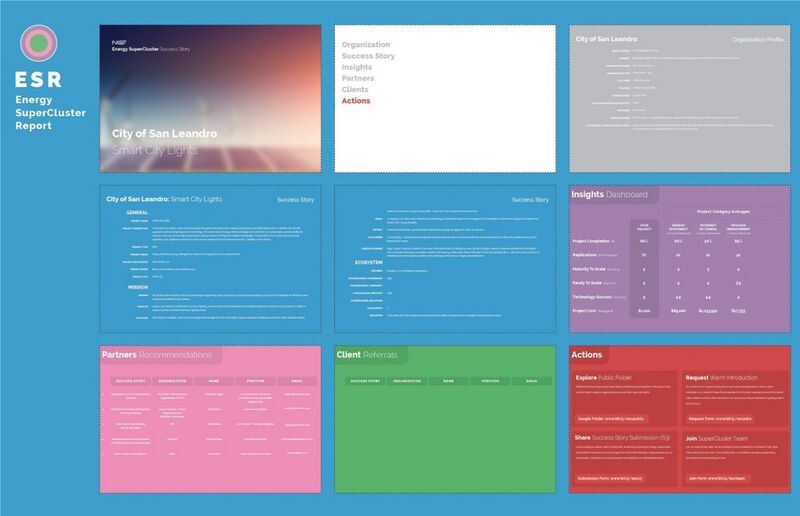
Above, you will see an example of an Energy SuperCluster Report (ESR) delivered back to Deborah Acosta, Chief Innovation Officer of City of San Leandro for her Smart City Lights S3 submission. As you can see, she does not have any Client Referrals due to her being a city municipal government. In the future, we imagine a potential Vendor Recommendations sheet to recommend to purchasers such as municipal governments.
Blueprint Snapshot
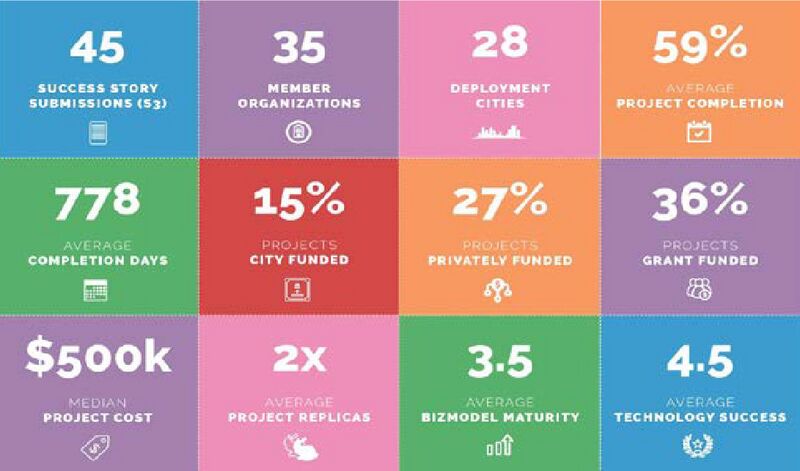
Above, you will find an aggregate of data that has been averaged out to create a distilled and simplified number of what the current S3s have produced in terms of insights. We have found that these general numbers have been useful to understand where we are from a benchmarking perspective to better share with others where we are, how we need to move forward and what goals to establish as a community of energy innovators.
Living Blueprint
State of the Field
We collected Success Stories from (45) smart city energy projects to learn about the current state of the field. The following information states the aggregate of data we received and processed.
Organization Type
- Government - 3 Cities
- Education - 18 Universities
- Community - 3 Non-Profit Organizations
- Industry - 5 Software Companies
- Industry - 8 Integrated Technology Companies
- Industry - 8 Services Companies
Organization Offerings
- Software - 29 Organizations
- Services - 17 Organizations
- Research & Development - 28 Organizations
- Governance - 2 Organizations
- Hardware - 9 Organizations
- Consulting - 2 Organizations
Project Types
- Energy Efficiency - 34 Projects
- Energy Management - 27 Projects
- Energy Generation - 17 Projects
- Electric Vehicles - 11 Projects
- Internet of Things - 34 Projects
- Distributed Energy - 18 Projects
- Microgrids - 16 Projects
- Process Improvement - 1 Project
- District Scale Applications - 1 Project
- Air Quality Monitoring - 1 Project
- Service Improvement - 1 Project
- Cloud Data and Analytics - 1 Project
- House Air Quality - 1 Project
- Housing Environment - 1 Project
- Efficient Trash Collection - 1 Project
- Demand Response - 1 Project
- Mapping & Control - 1 Project
Project Scope & Location
- Building Level - 27 Projects
- Multi-Building Level - 18 Projects
- Block Level - 12 Projects
- District Level - 22 Projects
- Citywide Level - 21 Projects
- Region Level - 3 Projects
- National Level - 1 Project
- Statewide Level - 0 Project
- International Level - 2 Projects
Project Missions & Goals
Projects had a wide variety of goals and missions. Some of the more common categories are listed below. Educating students, generating data and providing information were the most common project goals.
- Reduce Costs
- Generate Date & Provide Information
- Demonstrate & Test Concepts
- Reduce Energy Usage & Demand
- Improve Quality of Life for Citizens
- Community Education (Especially Students & Government)
- Build & Improve Infrastructure
- Build New Software Systems
- Meet Emissions Reduction Goals
- Growing a Business
Problems
Three common types of problems emerged:
- A need to transition to renewable energy, often to meet targets
- High energy costs
- A lack of available, high quality data to inform decisions and processes and a lack of systems to
harness this data once available
Solutions
Three primary types of solutions to these problems were pursued by projects:
- Upgrading infrastructure
- Creating knowledge, often through monitoring and data collection
- Creating systems and practices informed by data
Influencing regulation and facilitating collaboration among partners were also noted solutions.
Challenges
Projects faced a number of challenges related to business, engagement, policy and regulation, and technology. Many challenges reached across categories. For example, scaling was a challenge due to the level of financial and human resources needed to do so, as well as the technical challenge of generalizing a system built specifically for one city.
Technical Challenges
- Technology Integration with Existing Systems
- Data Security
- Ability to Obtain Necessary Data
- Scaling
Business Challenges
- Business Model Viability
- Financing
- Resource Availability
- Resources for Scaling
- Customer Recruitment & Retention
- Vendor Participation
Engagement Challenges
- Stakeholder Coordination
- Understanding User Behavior
- Technology Acceptance & Adoption
Policy and Regulation Challenges
- Municipal Processes
- Obtaining Data from Government
- Policy Environment
Lessons Learned
Five major categories of lessons learned emerged.
Technology Specific Lessons
Teams learned how to solve challenges they faced with their specific technology, whether it was maintaining the efficiency of geothermal systems or overheating air quality monitors.
Be Patient
Project teams learned that stakeholder engagement and working in the complex realm of government regulations can take longer than anticipated. One committee member stated: “Making changes in local government processes takes time. Building collaboration and being patience and persistence is necessary to being successful. Do not give up no matter the challenge.”
Stakeholder Engagement is Key
Project teams learned that engagement of all parties is crucial for success, whether that is local government, the owners of buildings, or citizens affected by the project. “Building owner and tenant engagement is vital to program success” “Regional collaboration between the public, private and academic sectors is key.”
Mismatched Abilities & Approach
Project teams learned that the state of technology and possibilities often did not match the approaches being taken by government or other organizations. As an emerging field, projects will need to learn to manage the tension of modernizing practices along with technology.
Business Lessons
Project teams also learned how to create new businesses and business models. “It takes time to create a new business management model.” “Understand your customer needs both during initial contact & during pilot, as well as production deployments. Never assume their needs.” “Start with a product that focuses on the needs of the early adopters to initiate revenue.” “Generate Key Performance Indicators (KPI) during pilot and production deployments. These are essential for ensuring further Venture Capital (VC) investment.”
Engagement
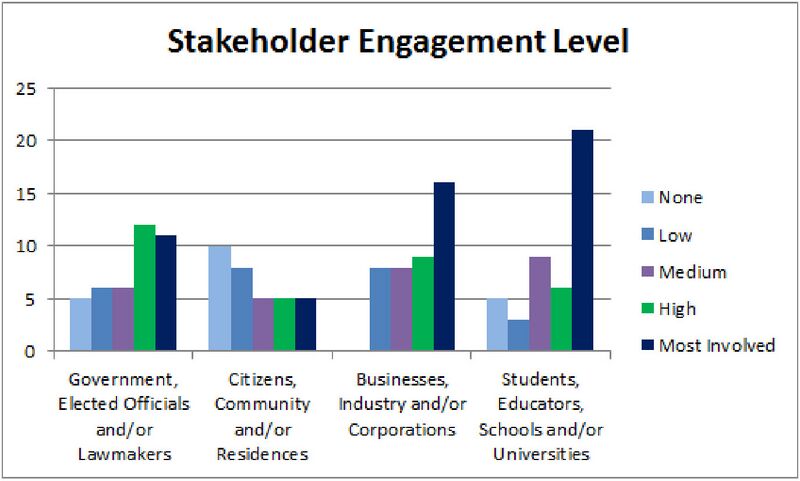
Energy Education for Community
Citizens and government emerged as the two clear groups that project teams needed to educate for their project to succeed. There was a range, however, in which groups within government were important to project success. Some listed elected officials at the local level as most important, while others focused on government technicians and operators or regulators and zoning officials. Businesses and universities also emerged less frequently as important groups to educate.
Metrics for Success
Projects utilized a broad range of metrics for their success, often using metrics across categories.
| External Designations |
|
| Business |
|
| Environmental Benefits |
|
| Economic Impact |
|
Results: Business and Finance
Project Costs
- Average Cost - $10,065,449
- Median Cost - $500,000
- Range - $11,000 - $150,000,000
Project Funding Sources
- Grants - 36%
- Private Investment - 27%
- City Funds - 15%
- Revenue - 8%
- Savings - 8%
- Shareholders - 1%
- Sponsorships - 1%
- Foundations - 2%
- University Funds - 1%
Project Length
- Average - 778 days
- Median - 372 days
- Range - 151 - 8735 days
Project Completion Stages
- Average - 59%
- Median - 60%
- Range - 0%-100%
Lessons Learned
It’s a relatively new field and this is reflected in the low number of replications of projects and the large number of pilot projects. Business models, funding, and stakeholder partnerships tend to be the limiting step for new projects, rather than technological capabilities.
Looking Forward
- Shift metrics for success to focus on measurable impacts for residents and citizens. More specific, measurable impacts will help justify funding and align priorities and goals among stakeholders.
- As projects mature and move out of pilot stages, increasing funding will be required. Attracting private capital to governments will help these projects scale, but currently, risk and misaligned processes can hinder partnerships between government and private capital. Looking forward, stakeholder engagement that brings all relevant parties together and provides pathways for partnership that can support scaling projects will be essential to success.
Results: Cities and Policy
Levels of Government Engaged
- Municipal - 32
- County - 12
- State - 16
- Federal - 23
- International - 4
Policy Innovations
What policy innovation(s) are projects actively solving for?
Major Themes
- Gaining data access
- Updating permitting, building codes, benchmarking requirements, and other policies.
Other Notable Policy Innovations
- Inclusion of smart city work in city’s general plan
- Creating financing, including incentives and rebates, to support projects.
- Updating utilities’ policies and rate structures to accommodate new technology and systems
- Using performance contract design to help mitigate risk to cities
- Pursue disclosure ordinances through municipal governments to gain access to data
Policy Challenges
- Access to Data
- Permitting, Zoning, or Regulation Hurdles
- Policy Area Undeveloped
Lessons Learned
Data access is a major challenge for many projects. While policy can be a hurdle to accessing data, it can also aid in obtaining data if municipalities pass disclosure ordinances to encourage or require the sharing of data.
Looking Forward
- While utility rate structures were not listed as a common barrier in this round of projects, we anticipate it becoming a more common problem as projects advance and scale. Updating rate structures to allow for the successful integration of new energy sources and new energy management practices will become increasingly essential to project success. Collaboration and best practice sharing across regions can aid this process.
- Permitting, zoning, and regulations were frequently cited barriers, but a more detailed classification of specific policy types is still unknown. Working to learn the specific policy challenges that projects face and collectively working to establish models and best practices to overcome them could help future projects face fewer hurdles.
- Financing is a common barrier for governments, especially when policies constrain their financing avenues. Learning more about policy barriers to financing and working to change them could aid future projects. For example, performance contract design is an attractive finance model to governments, but was previously against regulations in Georgia. Changing that policy has opened new possibilities for financing projects there.
Results: Data and Technology
Primary Data Types Collected
- Energy Consumption - 39
- Energy Generation - 23
- Internet of Things (IoT) - 35
- Distribution & Transmission - 13
- Environmental Quality - 22
- Financial - 19
- Policy - 15
- Time - 11
Other Types Mentioned
Process improvement and changes, geo-info, parking, building permits, energy disclosure ordinances, Building automation, water consumption, weather parameters, lighting & utilities.
Technology Types
- Hardware - 18
- Integrate - 37
- Software - 36
Technology Ownership
- Organization Owned - 30
- Owned by Others - 11
- Collaboration - 2
- Mixed Model - 2
Technology Success Ratings (Scale of 1-5)
- Average - 4.5 of 5
- Median - 5 of 5
- Range - 3 to 5
Reported Data Benefits (5 Main Categories)
- Public access to information and education
- Cost savings
- Benchmarks and project evaluation (ROI's can be measured)
- Improved compliance measurement by city
- Enable more targeted responses and interventions
Lessons Learned
Data Access is one of the largest and most common barriers that projects face. There are a number of ways to address it, including policy advocacy as well as technical workarounds. One project simulated building level energy usage data and then compared its estimates to aggregate data that was available. Others contracted with external organizations that specialized in retrieving data.
Looking Forward
- Move towards standardizing data formats as projects do gain access to it. This can mitigate transaction costs transferring data from one format to another.
- Integrate considerations for resiliency, sustainability, and equity intro projects missions and goals. These can be integrated into metrics for success and als influence the type of data monitored and the deployment of technology.
Conclusion
The story is not finished yet. We consider this a beginning to the journey, fight, failures and successes of energy innovation in our cities. The primary conclusion we have identified from this process is that we are building a culture of momentum in an inventive period as our infrastructure is digitized. We are both doing work in market and spurring a cultural transformation. It is as much a social dynamic as it is a political, financial or technological puzzle to discover what it means to be a smart city, particularly with fundamental resources such as utilities.
The number one call-to-action before concluding this first version of the energy blueprint is: contribute to it. Spend 30 minutes of your time to fill out a Success Story Submission (S3) at: www.bit.ly/escs3.